History & Status allows users to access a snapshot of processed shipments by date range or specific filters. Users can drill down within the widgets to view associated shipment detail, perform tracking, view email notifications, and more.
History & Status widgets include Shipment History, Shipments By Carrier, Shipments By Carrier Service. All widgets in this category display in a grid view, which you can modify and save. See Saving a View State for more information.
You can provide specific filters to customize the results that display
in a widget window. You can define filters in any of the History &
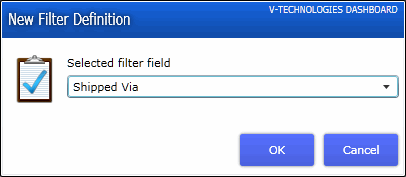
Status views by clicking the Add Filter button. In the New Filter Definition
window, select a field to filter shipments by and click OK.

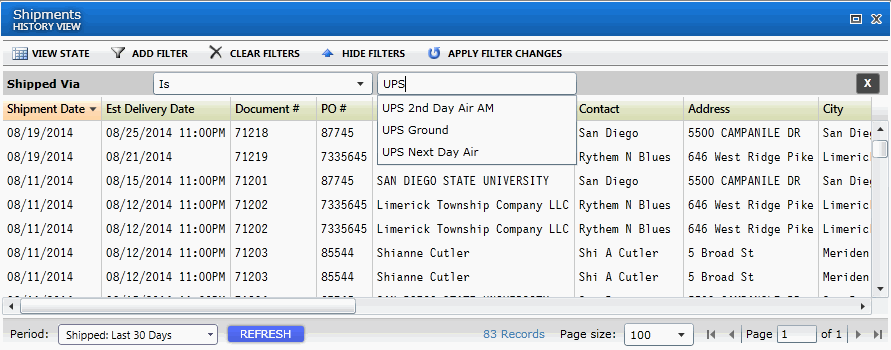
You can then select an operand (Is, Is not, Starts With, Ends With, etc.)
and type in the filter criteria. The dashboard may auto-complete text
entered into the filter field.
When adding multiple filters, note that all filters use the "AND" operator.
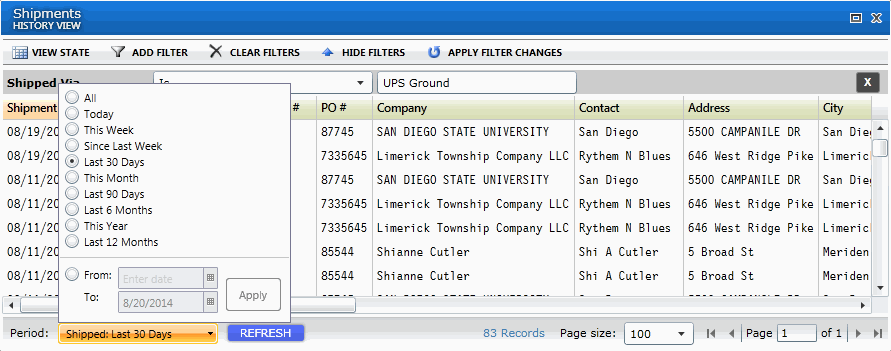
The Period filter, located at the bottom of the window, allows you to select a specific time period to search or define a specific date range. You can also select to filter shipments by the Process Date or Ship Date.
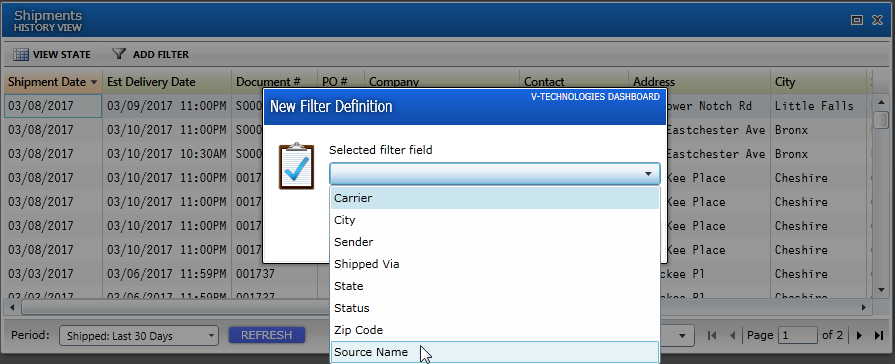
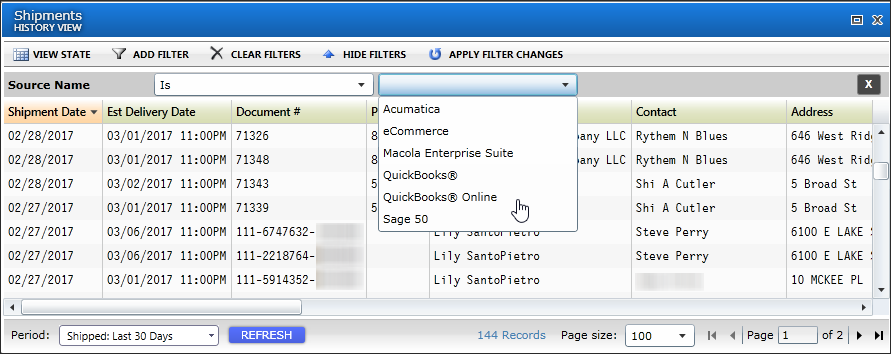
You can ship with multiple sources in ShipGear, and the V-Tech Dashboard allows you to filter shipments by a specific Source. Click the Add Filter button and in the New filter Definition dialog, select the "Source Name" field.
You can then select the operand (Is, Is Not, etc.) and select the source system you want to use in the filter.
Note about carrier names
When providing the filter parameters, note that the ® / ™ are not ignored but using the registered trademark or trademark in the filter field may have undesired results .
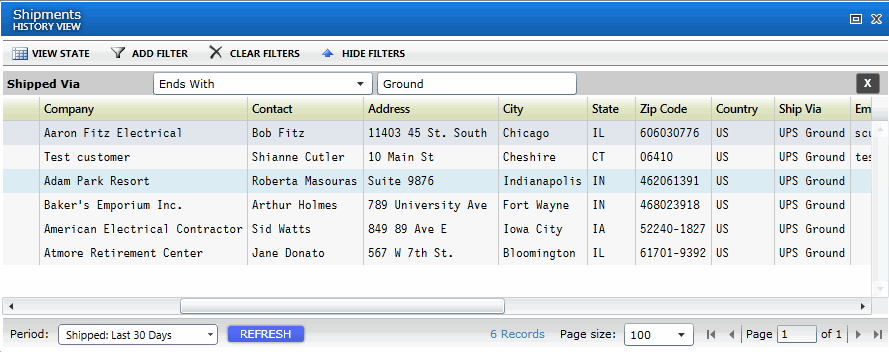
For example, if you use a filter such as "Shipped Via" + "Ends With" + "Ground", FedEx Ground shipments would not be returned because the actual Carrier/Service name is FedEx Ground®. Other services, such as UPS Ground, would be returned in the result because it does not have a trademark symbol in its name.
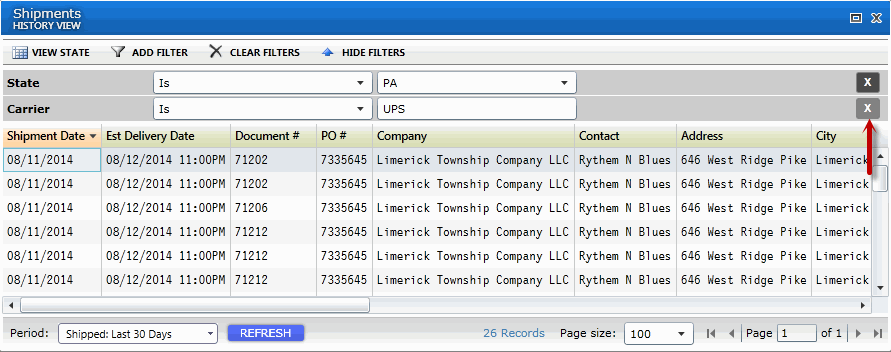
The Clear Filters button clears ALL filters. To delete an individual
filter, click the X in the filter's row.
The Apply Filter Changes button will reload data based on any changes you make to the filters. To hide filters from view, use the Hide Filters button. To restore hidden filters, click Show Filters.
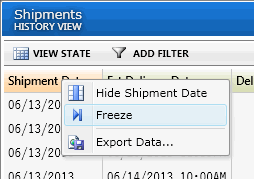
Right-click on a column heading to launch a menu that allow you to configure columns. Lists can be sorted by clicking on a column header in the widget.
The first entry (Hide) will reflect the name of the currently selected column. Once hidden, you can restore a hidden column by right-clicking on any column and selecting Restore Hidden Columns
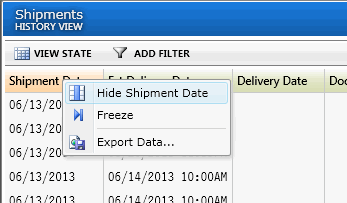
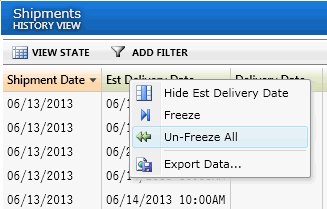
You can freeze or unfreeze a column's position in the view by right-clicking on the column header and selecting Freeze. To unfreeze a column, select Un-Freeze. You can also un-freeze all columns that are currently frozen by select Un-freeze All.
Some widgets allow you to save the current widget detail to an Excel file (XLS), an XML file, or a CSV file using the Export Data menu item.
Right-click on the shipment and select Export Data.
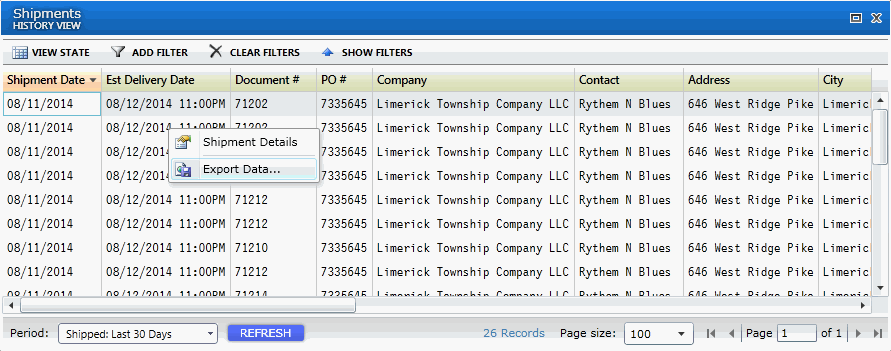
Enter a filename and click Save.

Note
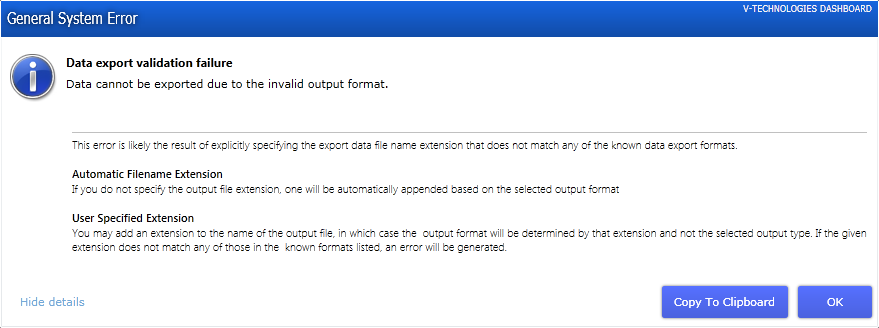
The only extensions supported are .xls, .xml, and .csv.
If you enter an invalid extension, you may receive the following error. Click OK and enter or select a supported extension.
Clicking the Refresh button on a widget forces a refresh of the data set. There is no automatic periodical update of the data.
To view more detail, right-click on the shipment row and select Shipment Details :

The Shipment Detail window displays general shipment data, such as the shipment and source interface information, as well as real-time status, charges/options, and package info. You can also :
use the eNotify Email Viewer to view any notification emails associated with the shipment.
retrieve updated shipment tracking data using
the Update Tracking Information button. The Tracking Information tab
gives you all of the most current tracking data.
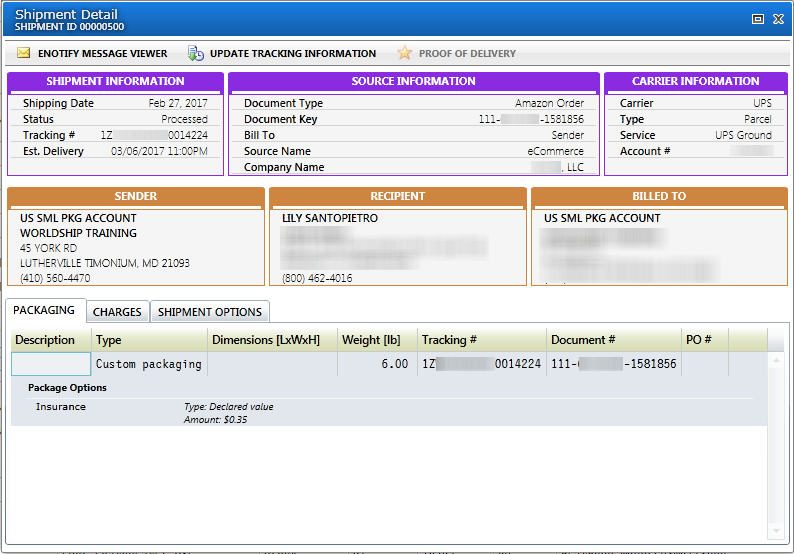
In any of these widgets, you can right-click on a shipment and select Shipment Detail for full information about a shipment.
This widget compiles a historical view of shipments based on the defined Period filter.
This widget generates a chart that compares shipment volume by carrier. Click on the carrier's section to view total shipments for that carrier. You can also drill down to the shipment level detail by right-clicking on the shipment and selecting Shipment Details.
This widget generates a chart comparing shipment volume by carrier service. Hover over the service to view the total shipments for that service. Click on a section to view the shipments. Shipment level detail is also available by clicking on the shipment and selecting Shipment Details.
The Performance Indicator Charts use a combination of pie charts and bar graphs to represent data for the selected period.
Click a pie slice to filter the bar graph so that only the selection's data is displayed. To return to the full view, click on the slice again. You can also click on a different pie slice to change the bar graph.
Hover over a pie slice to see the number of shipments that are represented by it.
Shift-click to multi-select pie pieces.
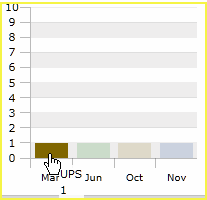
Hover over a bar graph color to see the number of shipments that are represented by it. (See image below.)
Click
on a bar graph section to launch a view of all the associated shipments.
You can then right-click on any shipment to view the shipment detail
in the Shipment Detail Record.
Charts can be arranged to display the bar graph and pie chart either horizontally (side-by-side) or vertically (stacked) in relation to each other. To change the chart arrangement, right-click on the chart and select Chart Arrangement.

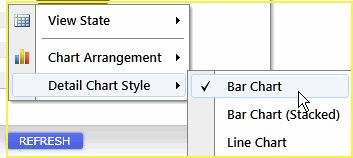
The detail chart refers to the bar graph that shows the data details. You can select to display bar graphs that present bars clustered in groups of more than one (bar chart), or bar graphs with bars divided into subparts to show cumulate effect (stacked bar chart). You can also select to display data in a line chart, which displays data as a series of data points connected by straight segments. Line charts allow you to visualize a trend in data over intervals of time.
To set the chart style, right-click on the chart and select Detail Chart Style.
This option displays a chart data view of the shipments.